The ancient Greeks recognized that interesting shapes can be formed by intersecting a plane with a double napped cone (i.e., two identical cones placed tip-to-tip as shown in the following figures). As these shapes are formed as sections of conics, they have earned the official name “conic sections.”
The three “most interesting” conic sections are given in the top row of Figure 10.1.2. They are the parabola, the ellipse (which includes circles) and the hyperbola. In each of these cases, the plane does not intersect the tips of the cones (usually taken to be the origin).
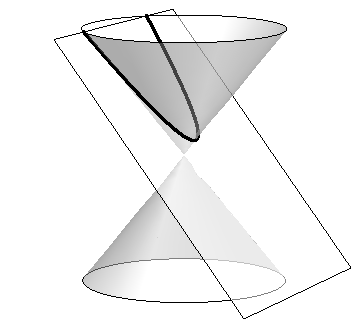
Two cones stacked tip-to-tip, intersected by a plane. A diagonal plane intersects the top cone. The plane does not touch the tip of either cones. The top edge of the plane intersects the top edge of the cone. The parts of the plane intersecting the cone are highlighted, which forms a parabola in the plane.
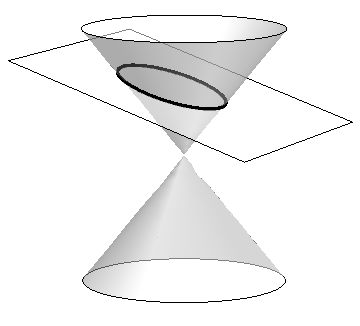
Two cones stacked tip-to-tip, intersected by a plane. A diagonal plane intersects the top cone. The plane does not touch the tip of either cones. The edge of the plane does not touch the top edge of the cone. The parts of the plane intersecting the cone are highlighted, which forms an ellipse in the plane.
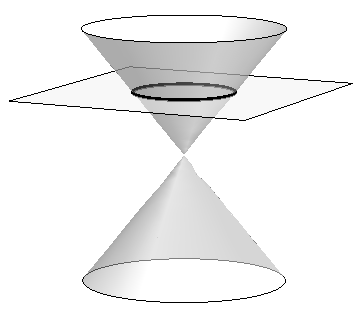
Two cones stacked tip-to-tip, intersected by a plane. A horizontal plane intersects the top cone. The parts of the plane intersecting the cone are highlighted, which forms a circle in the plane.
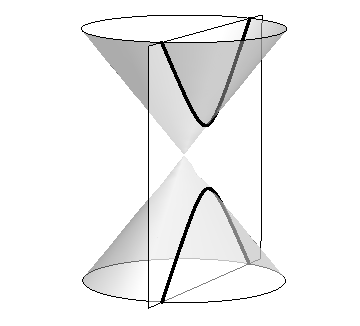
Two cones stacked tip-to-tip, intersected by a vertical plane. The plane does not pass through the tips of the cones. The parts of the plane intersecting the cones are highlighted, which forms a hyperbola in the plane. The hyperbola contains two seperate segments, with one placed vertically above the other with a space between them. The top segment is in the shape of a rounded v, and the bottom segment is a vertical reflection of the top segment.
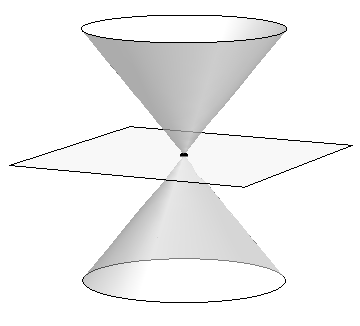
Two cones stacked tip-to-tip, intersected by a horizontal plane. The plane passes through the point where the tips of the two cones are touching. The plane touches the cone at only that single point, forming a point in the plane.
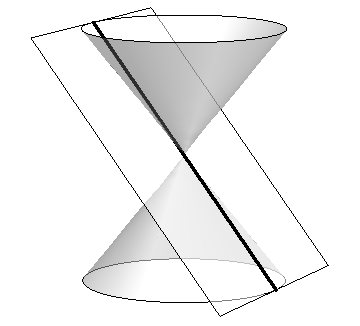
Two cones stacked tip-to-tip, intersected by a diagonal plane. The plane extends diagonally through the point where the tips of the cones are touching. The plane only touches the outer edges of the cones. The parts of the plane touching the cones are highlighted, forming a straight line in the plane.
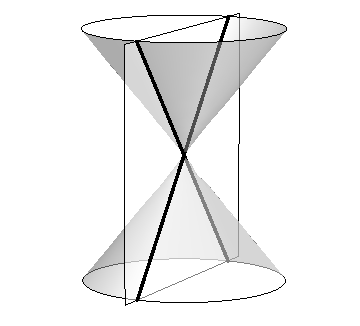
Two cones stacked tip-to-tip, intersected by a vertical plane. The plane extends vertically, passing through the points at which the tips of the cones touch. The parts of the plane intersecting the cones are highlighted, forming crossed straight lines in the plane. The image on the plane is straight lines in an X shape.
When the plane does contain the origin, three degenerate cones can be formed as shown the bottom row of Figure 10.1.2: a point, a line, and crossed lines. We focus here on the nondegenerate cases.
While the above geometric constructs define the conics in an intuitive, visual way, these constructs are not very helpful when trying to analyze the shapes algebraically or consider them as the graph of a function. It can be shown that all conics can be defined by the general second-degree equation
Each nondegenerate conic can be defined as the locus, or set, of points that satisfy a certain distance property. These distance properties can be used to generate an algebraic formula, allowing us to study each conic as the graph of a function.
An upward opening parabola with labels for key components. At the bottom of the parabola a point is labeled as the vertex. A dashed vertical line, labeled the axis of symmetry, separates the parabola into two halves. The axis of symmetry crosses the parabola through the vertex. Below the parabola, a horizontal line is labeled the Directrix. The distance between the directrix and the vertex is labeled \(p\text{.}\) Above the vertex, a point is drawn on the axis of symmetry and is labeled the "focus". The distance between the vertex and the focus is \(p\text{,}\) the same distance between the vertex and the directrix. On the right side of the parabola, a point is labeled \((x,y)\text{.}\) The distance between the point and the focus, and the distance between the point and the directrix are equal, labeled \(d\text{.}\)
Figure 10.1.5 illustrates this definition. The point halfway between the focus and the directrix is the vertex. The line through the focus, perpendicular to the directrix, is the axis of symmetry, as the portion of the parabola on one side of this line is the mirror-image of the portion on the opposite side.
The definition leads us to an algebraic formula for the parabola. Let \(P=(x,y)\) be a point on a parabola whose focus is at \(F=(0,p)\) and whose directrix is at \(y=-p\text{.}\) (We’ll assume for now that the focus lies on the \(y\)-axis; by placing the focus \(p\) units above the \(x\)-axis and the directrix \(p\) units below this axis, the vertex will be at \((0,0)\text{.}\))
The geometric definition of the parabola has led us to the familiar quadratic function whose graph is a parabola with vertex at the origin. When we allow the vertex to not be at \((0,0)\text{,}\) we get the following standard form of the parabola.
The vertex is located halfway between the focus and directrix, so \((h,k) = (1,2.5)\text{.}\) This gives \(p=-0.5\text{.}\) Using Key Idea 10.1.6 we have the equation of the parabola as
A downward opening parabola with a vertex in the first quadrant. The vertex of the parabola is at \((1,2.5)\text{.}\) The parabola crosses the \(x\)-axis at around \(x = -1.2\) and \(x = 3.2\text{.}\)
Example10.1.9.Finding the focus and directrix of a parabola.
Find the focus and directrix of the parabola \(x=\frac18y^2-y+1\text{.}\) The point \((7,12)\) lies on the graph of this parabola; verify that it is equidistant from the focus and directrix.
Hence the vertex is located at \((-1,4)\text{.}\) We have \(\frac18=\frac1{4p}\text{,}\) so \(p=2\text{.}\) We conclude that the focus is located at \((1,4)\) and the directrix is \(x=-3\text{.}\) The parabola is graphed in Figure 10.1.10, along with its focus and directrix.
A rightwards opening parabola with a vertex at \((-1,4)\text{.}\) The focus of the parabola is drawn at the point \((1,4)\text{.}\) The directrix is drawn as the vertical line at \(x=-3\text{.}\) The point \((7,12)\) is drawn lying on the parabola. The distance between the point and the directrix is drawn. The distance between the point and the focus is drawn. Both distances are labeled as \(10\) units long.
A parabola opening towards the right. The directrix is drawn as a vertical line to the left of the parabola. The focus is drawn as a point to the right of the vertex. Four different rays are emanating from the focus. The first line extends towards the top right, where it then reflects off the parabola and extends to the right. The second line extends upwards, where it then reflects off of the parabola and extends towards the right. The third line extends towards the lower left, where it then reflects off the parabola and extends towards the right. The fourth line exends twards the lower right, where it once again reflects off the parbola and extends towards the right. All of the rays extending towards the right are perpendicular to the directrix.
Because of this reflective property, paraboloids (the 3D analogue of parabolas) make for useful flashlight reflectors as the light from the bulb, ideally located at the focus, is reflected along parallel rays. Satellite dishes also have paraboloid shapes. Signals coming from satellites effectively approach the dish along parallel rays. The dish then focuses these rays at the focus, where the sensor is located.
An easy way to visualize this construction of an ellipse is to pin both ends of a string to a board. The pins become the foci. Holding a pencil tight against the string places the pencil on the ellipse; the sum of distances from the pencil to the pins is constant: the length of the string. See Figure 10.1.15.
Two points are drawn, around which an ellipse is sketched. A pencil is drawn, representing the sketching of the ellipse. The point of the pencil is touching the ellipse in the top right of the ellipse. The distances between the point of the pencil and the two foci are drawn. The distance between the left focus is labeled \(d_2\text{,}\) and the distance between the right focus is labeled \(d_1\text{.}\) It is clear that \(d_2\) is larger than \(d_1\text{.}\) Beneath the foci, it is written that \(d_1 + d_2 = \mathrm{constant}\text{.}\)
We can again find an algebraic equation for an ellipse using this geometric definition. Let the foci be located along the \(x\)-axis, \(c\) units from the origin. Let these foci be labeled as \(F_1 = (-c,0)\) and \(F_2=(c,0)\text{.}\) Let \(P=(x,y)\) be a point on the ellipse. The sum of distances from \(F_1\) to \(P\) (\(d_1\)) and from \(F_2\) to \(P\) (\(d_2\)) is a constant \(d\text{.}\) That is, \(d_1+d_2=d\text{.}\) Using the Distance Formula, we have
Using a fair amount of algebra can produce the following equation of an ellipse (note that the equation is an implicitly defined function; it has to be, as an ellipse fails the Vertical Line Test):
This choice of \(a\) and \(b\) is not without reason; as shown in Figure 10.1.16, the values of \(a\) and \(b\) have geometric meaning in the graph of the ellipse.
An ellipse is drawn with labels for key features. The ellipse is separated into 4 equal sections by a vertical and a horizontal line, which both pass through the center of the ellipse. The vertical line dividing the ellipse in half vertically is labeled as the "minor axis." The horizontal dividing the ellipse in half horizontally is labeled as the "major axis." The points on the major axis touching the ellipse are labeled as "vertices". Two points on the major axis are labeled as "foci". The foci both lie a short distance away from the vertices. The distance between the foci and their respective vertices is equal. The distance between the foci and the center is also equal. The distance between the left vertex and the minor axis is labeled \(a\text{.}\) The length of the major axis is \(2a\text{.}\) The length between the center and the top of the minor axis is labeled \(b\text{.}\) The length of the minor axis is \(2b\) The distance between the center and the right focus is labeled \(c\text{.}\)
In general, the two foci of an ellipse lie on the major axis of the ellipse, and the midpoint of the segment joining the two foci is the center. The major axis intersects the ellipse at two points, each of which is a vertex. The line segment through the center and perpendicular to the major axis is the minor axis. The “constant sum of distances” that defines the ellipse is the length of the major axis, i.e., \(2a\text{.}\)
An ellipse with a center at \((-3,1)\text{.}\) The ellipse has vertices at \((-3,6)\) and \((-3,4)\text{.}\) The ellipse appears to have a minor axis of length \(4\text{.}\)
The center is located at \((-3,1)\text{.}\) The distance from the center to a vertex is 5 units, hence \(a=5\text{.}\) The minor axis seems to have length 4, so \(b=2\text{.}\) Thus the equation of the ellipse is
It is simple to graph an ellipse once it is in standard form. In order to put the given equation in standard form, we must complete the square with both the \(x\) and \(y\) terms. We first rewrite the equation by regrouping:
We see the center of the ellipse is at \((1,2)\text{.}\) We have \(a=3\) and \(b=2\text{;}\) the major axis is horizontal, so the vertices are located at \((-2,2)\) and \((4,2)\text{.}\) We find \(c=\sqrt{9-4} = \sqrt{5}\approx 2.24\text{.}\) The foci are located along the major axis, approximately \(2.24\) units from the center, at \((1\pm 2.24,2)\text{.}\) This is all graphed in Figure 10.1.21
An ellipse centered at \((1,2)\text{.}\) The vertices of the ellipse are drawn at \((-2,2)\) and \((4,2)\text{.}\) Two foci are drawn at \((1 - 2.24, 2)\) and \((1 + 2.24, 2)\text{.}\) The minor axis of the ellipse has a length of 4.
the familiar equation of the circle centered at \((h,k)\) with radius \(a\text{.}\) Since \(a=b\text{,}\)\(c = \sqrt{a^2-b^2}=0\text{.}\) The circle has “two” foci, but they lie on the same point, the center of the circle.
Consider Figure 10.1.22, where several ellipses are graphed with \(a=1\text{.}\) In Figure 10.1.22(a), we have \(c=0\) and the ellipse is a circle. As \(c\) grows, the resulting ellipses look less and less circular. A measure of this “noncircularness” is eccentricity.
An ellipse with foci at around \((-0.2, 0)\) and \((0.2,2)\text{.}\) The major axis has a length of 2 and the minor axis has a length of about 1.8. It is written that \(e=0.3\)
An ellipse with foci drawn at \((-0.8,0)\) and \((0.8,0)\text{.}\) The major axis has a length of 2, and the minor axis has a length of around 1. Below the ellipse it is written that \(e = 0.8\text{.}\)
An ellipse with eccentricity 0. The vertices and the foci are at the same points, one at \((-1,0)\) and \((1,0)\text{.}\) The major axis has a length of 2, and the minor axis has a length of about 0.2.
The eccentricity of a circle is 0; that is, a circle has no “noncircularness.” As \(c\) approaches \(a\text{,}\)\(e\) approaches 1, giving rise to a very noncircular ellipse, as seen in Figure 10.1.22(d).
It was long assumed that planets had circular orbits. This is known to be incorrect; the orbits are elliptical. Earth has an eccentricity of \(0.0167\) — it has a nearly circular orbit. Mercury’s orbit is the most eccentric, with \(e=0.2056\text{.}\) (Pluto’s eccentricity is greater, at \(e=0.248\text{,}\) the greatest of all the currently known dwarf planets.) The planet with the most circular orbit is Venus, with \(e=0.0068\text{.}\) The Earth’s moon has an eccentricity of \(e=0.0549\text{,}\) also very circular.
The ellipse also possesses an interesting reflective property. Any ray emanating from one focus of an ellipse reflects off the ellipse along a line through the other focus, as illustrated in Figure 10.1.24. This property is given formally in the following theorem.
An ellipse with the foci drawn. The left focus is labeled \(F_1\text{,}\) and the right focus is labeled \(F_2\text{.}\) A ray is emanating from \(F_1\) towards the bottom right. It then reflects off the ellipse to the upper right, where it then passes through \(F_2\text{.}\) A ray also emanates from \(F_2\) towards the upper right. It then reflects off the ellipse towards the bottom left, where it then passes through \(F_1\text{.}\)
Let \(P\) be a point on a ellipse with foci \(F_1\) and \(F_2\text{.}\) The tangent line to the ellipse at \(P\) makes equal angles with the following two lines:
A hyperbola is the locus of all points where the absolute value of difference of distances from two fixed points, each a focus of the hyperbola, is constant.
We do not have a convenient way of visualizing the construction of a hyperbola as we did for the ellipse. The geometric definition does allow us to find an algebraic expression that describes it. It will be useful to define some terms first.
The two foci lie on the transverse axis of the hyperbola; the midpoint of the line segment joining the foci is the center of the hyperbola. The transverse axis intersects the hyperbola at two points, each a vertex of the hyperbola. The line through the center and perpendicular to the transverse axis is the conjugate axis. This is illustrated in Figure 10.1.28. It is easy to show that the constant difference of distances used in the definition of the hyperbola is the distance between the vertices, i.e., \(2a\text{.}\)
A hyperbola with labels for key components. The hyperbola is composed of two seperate segments with a space between them. The first shape is on the left. The shape begins in the upper left, moving almost linearly towards the lower right. The curve then begins to bend gently backwards before moving linearly towards the bottom left. The right curve is a reflection of the left curve. It opens towards the right. The entire hyperbola is separated into 4 equal segments by two axes. The axis dividing the hyperola in half vertically is labeled as the "conjugate axis." The axis dividing th ehyperbola in half horizontally is labeled as the "transverse axis." The point in which the axes touch is the center of the hyperbola. The points in which the curves intersect the transverse axis are labeled as foci. Two foci lie on the transverse axis. The first focus is to the left of the left curve. The right focus is to the right of the right curve. The distance between the left vertex and the center is labeled as \(a\text{.}\) The distance between the center and the right focus is labeled as \(c\text{.}\)
Consider the hyperbola \(\frac{x^2}9-\frac{y^2}1 = 1\text{.}\) Solving for \(y\text{,}\) we find \(y=\pm\sqrt{x^2/9-1}\text{.}\) As \(x\) grows large, the “\(-1\)” part of the equation for \(y\) becomes less significant and \(y\approx \pm\sqrt{x^2/9} = \pm x/3\text{.}\) That is, as \(x\) gets large, the graph of the hyperbola looks very much like the lines \(y=\pm x/3\text{.}\) These lines are asymptotes of the hyperbola, as shown in Figure 10.1.30.
A graph of the hyperbola \(\frac{x^2}{9} - \frac{y^2}{1} = 1\text{,}\) along with its two asymptotes. The hyperbola is centered at the origin, with vertices at\((-3,0)\) and \((3,0)\text{.}\) Two asymptotes are drawn from the equations \(y = \frac{x}{3}\) and \(y = -\frac{x}{3}\text{.}\) As the hyperbola extends outwards from the origin, it becomes close to the asymptotes.
This is a valuable tool in sketching. Given the equation of a hyperbola in general form, draw a rectangle centered at \((h,k)\) with sides of length \(2a\) parallel to the transverse axis and sides of length \(2b\) parallel to the conjugate axis. (See Figure 10.1.31 for an example with a horizontal transverse axis.) The diagonals of the rectangle lie on the asymptotes.
A hyperbola sketched using a rectangle. A center of the rectangle is drawn at the point \((h,k)\text{.}\) The rectangle has a width of \(2a\) and a height of \(2b\text{.}\) The vertices are drawn at the points \((h-a,k)\) and \((h+a,k)\text{.}\) The asymptotes are drawn as the lines passing through the center and the corners of the rectangle. The hyperbola is then drawn, following the asymptotes, touching the vertices, and then moving away from the center to follow the asymptotes.
These lines pass through \((h,k)\text{.}\) When the transverse axis is horizontal, the slopes are \(\pm b/a\text{;}\) when the transverse axis is vertical, their slopes are \(\pm a/b\text{.}\) This gives equations:
The hyperbola is centered at \((1,2)\text{;}\)\(a=5\) and \(b=2\text{.}\) In Figure 10.1.33 we draw the prescribed rectangle centered at \((1,2)\) along with the asymptotes defined by its diagonals. The hyperbola has a vertical transverse axis, so the vertices are located at \((1,7)\) and \((1,-3)\text{.}\) This is enough to make a good sketch.
A graph of the hyperbola given in Example 10.1.32. The hyperbola has the equation \(\frac{(y-2)^2}{25} - \frac{(x-1)^2}{4} = 1\text{.}\) The center of the hyperbola is drawn at \((1,2)\text{.}\) A rectangle is drawn around the center, with a height of \(10\) and a width of \(4\text{.}\) At the top and bottom of the rectangle, the vertices of the hyperbola are drawn at \((1,7)\) and \((1,-3)\text{.}\) The asymptotes of the hyperbola are drawn passing through the corners of the rectangle and the center. The hyperbola is then drawn above and below the rectangle, opening upwards and downwards respectively. The foci are also drawn a short distance above and below the vertices. The top focus is near the point \((1, 7.4)\) and the bottom focus is near the point \((1,-3.4)\text{.}\)
We also find the location of the foci: as \(c^2= a^2+b^2\text{,}\) we have \(c=\sqrt{29}\approx 5.4\text{.}\) Thus the foci are located at \((1,2\pm 5.4)\) as shown in the figure.
We must complete the square to put the equation in general form. (We recognize this as a hyperbola since it is a general quadratic equation and the \(x^2\) and \(y^2\) terms have opposite signs.)
The hyperbola described in Example 10.1.34. The hyperbola comes from the equation \(9x^2 - y^2 + 2y = 10\text{.}\) The hyperbola is centered at \((0,1)\text{,}\) around which a rectangle is drawn. The rectangle has a height of 6 and a width of 2. The vertices are drawn on the left and right sides of the rectangle, at the points \((-1,1)\) and \((1,1)\text{.}\) The hyperbola is the drawn, opening to the left and right and following the diagonal asymptotes, which are also drawn. The foci are also drawn at the points \((-3.2,1)\) and \((3.2,1)\text{.}\)
We see the hyperbola is centered at \((0,1)\text{,}\) with a horizontal transverse axis, where \(a=1\) and \(b=3\text{.}\) The appropriate rectangle is sketched in Figure 10.1.35 along with the asymptotes of the hyperbola. The vertices are located at \((\pm 1,1)\text{.}\) We have \(c=\sqrt{10}\approx 3.2\text{,}\) so the foci are located at \((\pm 3.2,1)\) as shown in the figure.
Note that this is the definition of eccentricity as used for the ellipse. When \(c\) is close in value to \(a\) (i.e., \(e\approx 1\)), the hyperbola is very narrow (looking almost like crossed lines). Figure 10.1.37 shows hyperbolas centered at the origin with \(a=1\text{.}\) The graph in Figure 10.1.37(a) has \(c=1.05\text{,}\) giving an eccentricity of \(e=1.05\text{,}\) which is close to 1. As \(c\) grows larger, the hyperbola widens and begins to look like parallel lines, as shown in Figure 10.1.37(d).
A hyperbola with eccentricity 1.05. The hyperbola is centered at the origin. The vertices are drawn to the left and right of the center. The foci are also drawn, and are shown to be very close to the vertices. The hyperbola is quite narrow, only slowing spreading out vertically as the curve moves away from the center. Below the hyperbola it is written that \(e=1.05\text{.}\)
A hyperbola with eccentricity 1.5. The hyperbola is centered at the origin. The vertices are drawn to the left and right of the center. The foci are drawn next to the vertices. The foci are a short distance away from the vertices. The hyperbola is of moderate width, increasing horizontally and vertically at a similar rate. Below the hyperbola it is written that \(e=1.5\)
A hyperbola with eccentricity 3, centered at the origin. The vertices are drawn to the left and right of the center. The foci are drawn, and are a moderate distance away from the vertices. The hyperbola is quite wide, quickly increasing vertically as the curve moves further from the origin. Below the hyperbola it is written that \(e = 3\text{.}\)
A hyperbola of eccentricity 10, centered at the origin. The vertices are drawn to the left and right of the center. The foci are drawn a large distance form the vertices. The hyperbola is very wide, increasing vertically significantly more quickly than horizontally. Below the hyperbola it is written that \(e=10\text{.}\)
Hyperbolas share a similar reflective property with ellipses. However, in the case of a hyperbola, a ray emanating from a focus that intersects the hyperbola reflects along a line containing the other focus, but moving away from that focus. This is illustrated in Figure 10.1.39 (on the next page). Hyperbolic mirrors are commonly used in telescopes because of this reflective property. It is stated formally in the following theorem.
Let \(P\) be a point on a hyperbola with foci \(F_1\) and \(F_2\text{.}\) The tangent line to the hyperbola at \(P\) makes equal angles with the following two lines:
Determining the location of a known event has many practical uses (locating the epicenter of an earthquake, an airplane crash site, the position of the person speaking in a large room, etc.).
To determine the location of an earthquake’s epicenter, seismologists use trilateration (not to be confused with triangulation). A seismograph allows one to determine how far away the epicenter was; using three separate readings, the location of the epicenter can be approximated.
A key to this method is knowing distances. What if this information is not available? Consider three microphones at positions \(A\text{,}\)\(B\) and \(C\) which all record a noise (a person’s voice, an explosion, etc.) created at unknown location \(D\text{.}\) The microphone does not “know” when the sound was created, only when the sound was detected. How can the location be determined in such a situation?
A hyperbola with rays emanating from the left focus. The ray moves towards the right, reflecting off a point on the right side of the hyperbola. The reflected ray moves towards the upper left. A dashed line is drawn between the right focus and the point where the ray touches the hyperbola. The reflected ray is moving in the same direction as the dashed line.
If each location has a clock set to the same time, hyperbolas can be used to determine the location. Suppose the microphone at position \(A\) records the sound at exactly 12:00, location \(B\) records the time exactly 1 second later, and location \(C\) records the noise exactly 2 seconds after that. We are interested in the difference of times. Since the speed of sound is approximately 340 m/s, we can conclude quickly that the sound was created 340 meters closer to position \(A\) than position \(B\text{.}\) If \(A\) and \(B\) are a known distance apart (as shown in Figure 10.1.40(a)), then we can determine a hyperbola on which \(D\) must lie.
The “difference of distances” is 340; this is also the distance between vertices of the hyperbola. So we know \(2a= 340\text{.}\) Positions \(A\) and \(B\) lie on the foci, so \(2c=1000\text{.}\) From this we can find \(b\approx 470\) and can sketch the hyperbola, given in Figure 10.1.40(b). We only care about the side closest to \(A\text{.}\) (Why?)
We can also find the hyperbola defined by positions \(B\) and \(C\text{.}\) In this case, \(2a = 680\) as the sound traveled an extra 2 seconds to get to \(C\text{.}\) We still have \(2c=1000\text{,}\) centering this hyperbola at \((-500,500)\text{.}\) We find \(b\approx 367\text{.}\) This hyperbola is sketched in Figure 10.1.40(c). The intersection point of the two graphs is the location of the sound, at approximately \((188,-222.5)\text{.}\)
Three points drawn and labeled on a plane. \(A\) is at the point \((500,0)\text{.}\)\(B\) is at the point \((-500,0)\text{.}\)\(C\) is at the point \((-500,1000)\text{.}\)
A hyperbola drawn from points \(A\) and \(B\) in Figure 10.1.40(a). \(A\) and \(B\) are the foci of the hyperbola. The vertices of the hyperbola are 170 units away from the origin. The left half of the hyperbola is drawn with a dashed line, while the right half of the parabola is drawn with a solid line.
A hyperbola drawn from points \(B\) and \(C\) in Figure 10.1.40(a), intersecting with the hyperbola drawn in Figure 10.1.40(b). The hyperbola uses \(B\) and \(C\) as the foci. The vertices of the hyperbola are 640 units apart. The bottom hyperbola, with focus \(B\text{,}\) extends towards the right. The point at which it intersects with the hyperbola with focus \(A\) is labeled as \(D\text{.}\)
This chapter explores curves in the plane, in particular curves that cannot be described by functions of the form \(y=f(x)\text{.}\) In this section, we learned of ellipses and hyperbolas that are defined implicitly, not explicitly. In the following sections, we will learn completely new ways of describing curves in the plane, using parametric equations and polar coordinates, then study these curves using calculus techniques.
Explain why the following is true: “If the coefficient of the \(x^2\) term in the equation of an ellipse in standard form is smaller than the coefficient of the \(y^2\) term, then the ellipse has a horizontal major axis.”
The equation of a parabola and a point on its graph are given. Find the focus and directrix of the parabola, and verify that the given point is equidistant from the focus and directrix.
An ellipse centered at the point \((1,2)\text{.}\) The major axis has a length of 6. The minor axis has a length of 4. The vertices of the graph are at the points \((-4,2)\) and \((2,2)\text{.}\)
An ellipse centered on the point \((1,0)\text{.}\) The vertices of the ellipse are at the points \((1,3)\) and \((1,-3)\text{.}\) The major axis appears to have a length of 6. The minor axis has a length of 1.
A hyperbola centered at the origin with a horizontal transverse axis. The foci of the hyperbola are at the points \((-2,0)\) and \((2,0)\text{.}\) The vertices of the hyperbola are at the points \((-1,0)\) and \((1,0)\)
A hyperbola centered at the origin with a vertical transverse axis. The hyperbola has foci at the points \((0,5)\) and \((0,-5)\text{.}\) The vertices of the ellipse are at the points \((0,1)\) and \((0,-1)\text{.}\)
A hyperbola with center \((1,3)\) and a vertical transverse axis. The foci of the hyperbola are not drawn. The vertices of the hyperbola are at the points \((1,5)\) and \((1,1)\text{.}\) A box is drawn around the origin with a width of 6 and a height of 4. The diagonal asymptotes are drawn as the lines passing through the corners of the box, passing through the center.
A hyperbola centered at the point \((1,3)\) with a horizontal transverse axis. The foci of the hyperbola are not drawn. The vertices of the hyperbola are at the points \((-2,3)\) and \((4,3)\text{.}\) A box is drawn around the center with a width of 6 and a height of 4. The diagonal asymptotes are drawn as the lines passing through the corners of the box, passing through the center.
The points \(P_1 = (2,6)\) and \(P_2 = (1+\sqrt{2},3+\sqrt{6}) \approx (2.414,5.449)\) lie on the ellipse. Verify that the sum of distances from each point to the foci is the same.
Johannes Kepler discovered that the planets of our solar system have elliptical orbits with the Sun at one focus. The Earth’s elliptical orbit is used as a standard unit of distance; the distance from the center of Earth’s elliptical orbit to one vertex is 1 Astronomical Unit, or A.U.
For each planet, find equations of their elliptical orbit of the form \(\ds\frac{x^2}{a^2}+\frac{y^2}{b^2}=1\text{.}\) (This places the center at \((0,0)\text{,}\) but the Sun is in a different location for each planet.)
A loud sound is recorded at three stations that lie on a line as shown in the figure below. Station \(A\) recorded the sound 1 second after Station \(B\text{,}\) and Station \(C\) recorded the sound 3 seconds after \(B\text{.}\) Using the speed of sound as 340m/s, determine the location of the sound’s origination.
A number line with 3 seperate points drawn. \(A\) is the left most point. \(B\) is the point in the middle. The distance between \(A\) and \(B\) is \(1000\mathrm{m}\text{.}\)\(C\) is the left most point. The distance between \(B\) and \(C\) is \(2000 \mathrm{m}\text{.}\)